Insert component
On the Insert Component tab, click the component to be added, and then drag and drop.
OZ Designer offers a band-oriented design environment. So you have to insert bands such as header, footer, and data band first and then, insert components such as labels, charts, tables.
The complex components such as table, crosstab, chart, and Gantt chart should be bound to data using wizard. So you have to add datasets such as ODI or CSV data to the report before inserting components.
This section explains adding ODI dataset and inserting page header band, page footer band, data band, label, and chart.
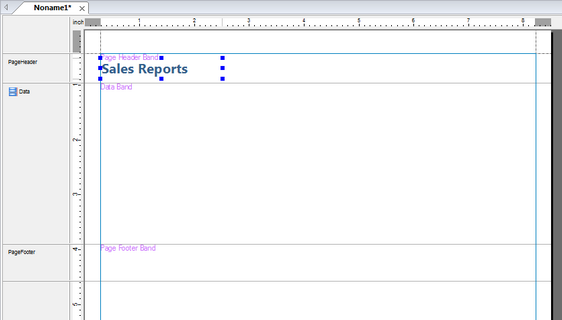
In the Repository window, find and double-click your ODI file to bind. Data Information window shows the added dataset.
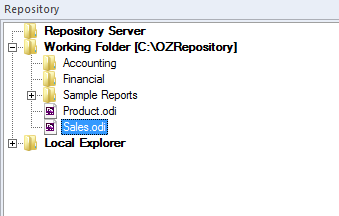
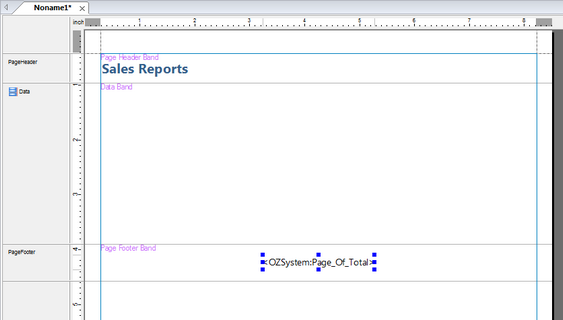
On the Insert Band tab, in the Page Band group, click Page Header Band, and then drag and drop to the report window. In the same way, add the Page Footer Band and the Data Band.
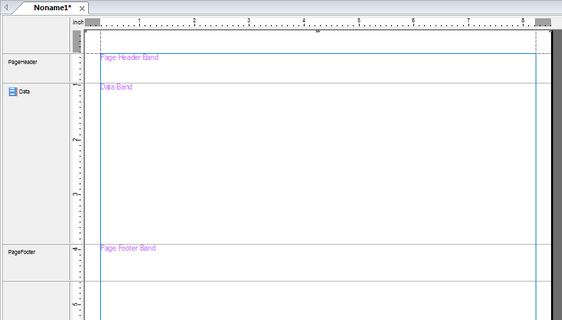
On the Insert Component tab, in the Label group, click Normal, and then drag and drop to the Page Header Band.
Enter "Sales Reports" for the Text property in the label's property window. Configure font, border, and other properties using the Format dialog of the label.
On the Insert Component tab, in the Label group, click System, and then drag and drop to the Page Footer Band.
Click "Page_Of_Total" for the System Field Name property in the label's property window. Configure font, border, and other properties using the Format dialog of the label.
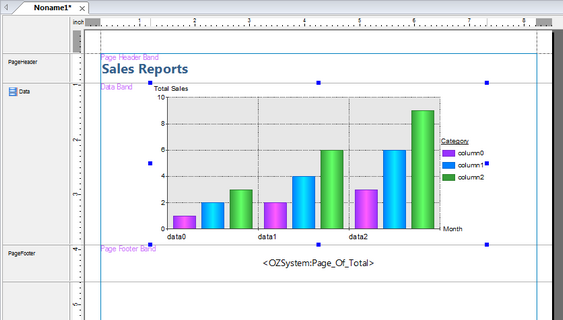
On the Insert Component tab, in the Multiplex group, click Chart, and then drag and drop to the Page Footer Band.
Configure chart type, data fields, axes, and other options using the Chart Wizard. By clicking OK, a chart appears.