Data Label
Sets the data label and tooltip of the chart.
Data Label
Sets the position of data label.
Data to Show
Sets the contents to be displayed in the data label.
If all options are checked, the data label will be displayed in the order of Series Name, Item Name, Value, Percentage.
Tooltip
Show - If selected, the corresponding value of the graph will be displayed in tooltip format (balloon shaped help) in the Viewer.
Show the same as data label - Determines whether to display a tooltip the same as data label.
Boundary radius - Sets how close mouse has to approach the vertex for the tooltip to appear.
Example - By Series
When there are multiple Y-Axis field Each item in accordance with the order of items in the set By Series dialog whether to display data labels is determined.
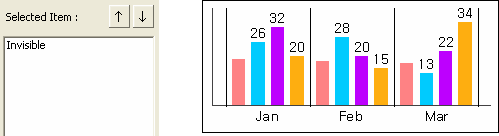
If you set Selected Item "Invisible" only
If only "Invisible" is set to the selected item, only the first displayed legend label is hidden, and the remaining labels will be displayed.
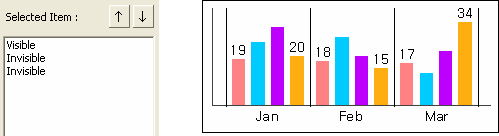
If you set Selected Item "Visible, Invisible, Invisible" in order
If the selected item is set to in the order of "Visible, Invisible, Invisible", the first legend will be displayed, the second and third legends will not be displayed, and the remaining labels will be displayed.