Example - If X-Axis Data Type is Item
Category(X) Join, Use Tree
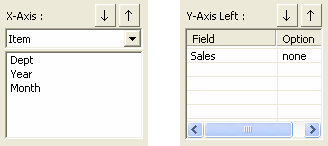
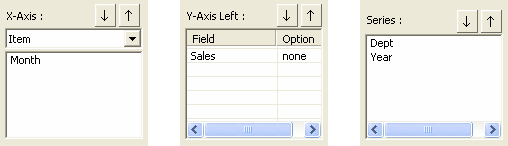
For example, if you have set the left Y-Axis and X-Axis as shown in the figure below, depending on whether the option is checked, the X-Axis labels and gridlines are configured differently.
If you have not checked Category(X) Join and Use Tree
Display the Month field value as the main grid and the chart separated by the Year field values.
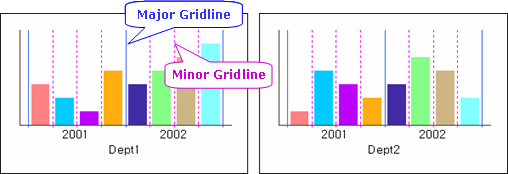
If you check Category(X) Join
Displays the Month field value as the minor grid and the Year field value as the major grid, and the chart separated by the Dept field values.
If you check Use tree and the number of fields is set to 2
Displays two fields, Month and Year fields, in form of a tree, and the chart separated by the Dept field values. A gray divider is displayed indicating that the Month field is a child node of the Year field.
If you check Use tree and the number of fields is set to 3
Displays three fields, Month, Year, and Dept fields, in form of a tree. Gray dividers are displayed indicating that the Month field is a child node of the Year field and the Year field is a child node of the Dept field.
Adjust X-Axis to each series
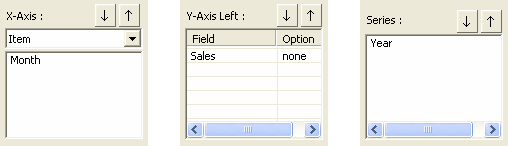
For Example, if the X-Axis, left Y-Axis, and series are set as shown in the figure below, depending on whether the option is checked, the X Axis labels are configured differently.
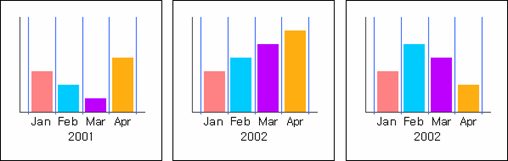
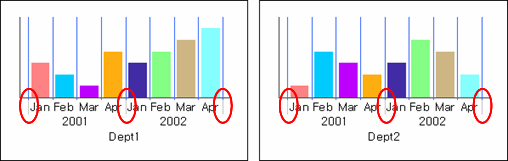
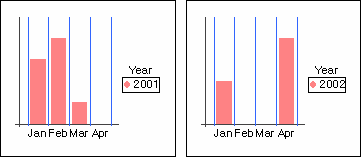
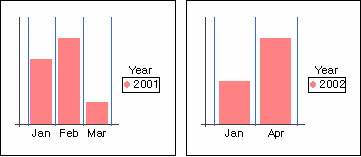
If you set Max Series Number property value to 1 and have not checked Adjust X-Axis to each series
Regardless of the series, all X-Axis labels are configured identically. In other words, when Year is 2001, Apr is displayed on the X-Axis label even if there is no data value, and when Year is 2002, Feb and Mar are displayed on the X-Axis label even if there are no data value.
If you set Max Series Number property value to 1 and check Adjust X-Axis to each series
Configures the X-axis label only with the values of the X-axis fields corresponding to each series. In other words, when Year is 2001, Apr is not displayed on the X-Axis label due to no data value, and when Year is 2002, Feb and Mar are not displayed due to no data value.
Adjust X-Axis for all series
For example, if the X-Axis, left Y-Axis, and series are set as shown in the figure below, depending on whether the option is checked, the X Axis labels are configured differently.
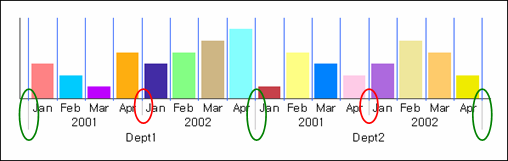
If you have not checked Adjust X-Axis for all series
Regardless of the series, all X-Axis labels are configured identically. In other words, when Dept is Dept1, Apr is displayed on the X-Axis label even if there is no Apr data value, and when Dept is Dept2, Feb and Mar are displayed on the X-Axis label even if there are no data value.
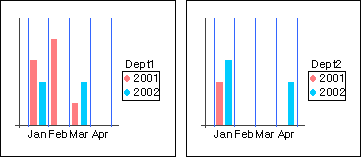
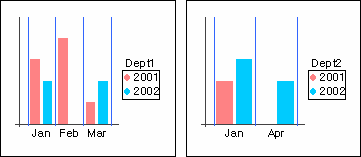
If you check Adjust X-Axis for all series
Configures the X-axis label only with the values of the X-axis fields corresponding to each series. In other words, when Dept is Dept1, Apr is not displayed on the X-Axis label due to no data value, and when Dept is Dept2, Feb and Mar are not displayed due to no data value.
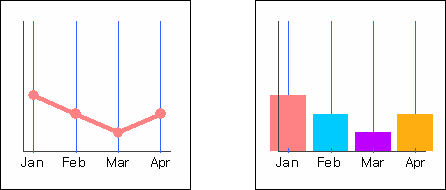
Value(Y) axis crosses between category(X)
Depending on the value of the option, the positions of bars and markers displaying the X-Axis label and the Y-Axis value are configured differently.
If you set Value(Y) axis crosses between category(X) to Default
Depending on the chart type, it automatically applies yes or no. In other words, "False" is applied to a linear chart, and "True" is applied to a bar chart.
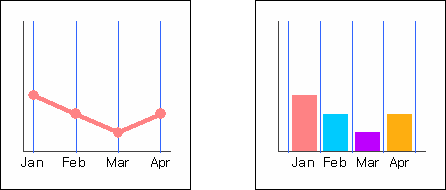
If you set Value(Y) axis crosses between category(X) to True
Regardless of the chart type, displays the X-Axis labels and Y-Axis values between items.
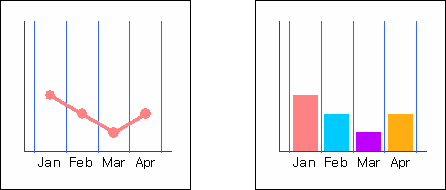
If you set Value(Y) axis crosses between category(X) to False
Regardless of the chart type, displays the X-Axis labels and Y-Axis values on the item lines (gridlines).