Show Empty Chart
Determines whether or not to show empty chart.
Set to True if you want to show, or False to hide.
When a chart has no dataset rows to show as graph, only show border, axes and major gridlines without graph.
Set the property value of Repeat Number in Data band bigger than 0 to show the empty chart.
Example
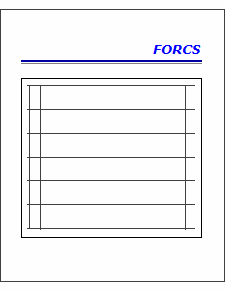
If a chart has no dataset rows and the Repeat Number property value is 1, it shows as below.
True |
False |
|---|---|
|
|
Show label, line and empty chart in data band |
Show label and line without empty chart in data band |